Baseball Adoption History By Country


flash"
src="https://9602b3bf-a-62cb3a1a-s-sites.googlegroups.com/site/rgodfreyflashstuff/FINAL.swf
pluginspage="
http://www.macromedia.com/go/getflashplayer" height="600" width="600">


Final project on Baseball Adoption History.

https://sites.google.com/site/rgodfreyflashstuff/system/app/pages/admin/attachments
https://9602b3bf-a-62cb3a1a-s-sites.googlegroups.com/site/rgodfreyflashstuff/FINAL.swf

Hover-Over images - Banda Aceh, Indonesia


This technique shows the destruction that hit Banda Aceh, Indonesia on December 28, 2004 or 2 days after the a 9.3 earthquake (3rd largest ever recorded) created a tsunami in the Indian Ocean.  The first image was taken 3 months prior on June 23 when the city was still intact.  This Flash technique highlights the amazing tsunami destruction with a direct overlay.

Click once for the tsunami sound.

Google/Trimble Sketchup


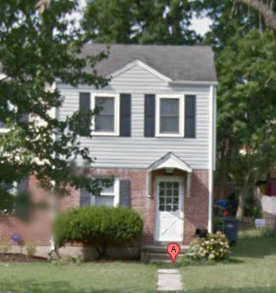
This week I'm working with Google (soon to be Trimble) Sketchup and did my duplex.  After it's finished, you can click on "Share Model" and then upload it to the Trimble 3D Warehouse which will then submit it for review in Google Earth.  This is a neat way to build up your neighborhood in Google Earth for 3D modeling!

Google Building Maker

For Google Building Maker, I chose the Fort Sam Houston Library in Texas.  The A/C units on the top of the building took awhile.

Advanced Flash Techniques, Part B


Part B of the Advanced Flash Techniques where I created a virtual camera that pans into areas that have high parasite malaria risk on a global scale.  The Start and Stop buttons can start or stop the animation at any time in the loop!

Advanced Flash Techniques, Part A


Part A of the Advanced Flash Techniques where I created a button that will zoom in on the map, as well as 4 directional Pan arrows that were scripted.

Final Project Plan


For my final project, I am going to do the history of baseball and its global adoption nationwide over time.  I plan to design this very similar to historic maps that depict how an empire has geographically spread throughout time.  So there will be a timeline incorporated as the map pans and zooms to different scales to tell its story.

For a majority of the project I think the map will be focused on the United States so I will have to incorporate more detail at this larger scale and then will zoom back out as other countries come into play.

Finding data regarding origin is easy to find :
http://en.wikipedia.org/wiki/History_of_baseball_outside_the_United_States , but how to change each boundary and at what rate could be an issue.

I found some data on Little League regions which is probably what my final map should look like so it's a start:
http://commons.wikimedia.org/wiki/File:Little_League_Baseball_Map.png

The end product should look like the Maps of War series:
http://www.mapsofwar.com/ind/imperial-history.html

As each country is triggered on the timeline, the map will simultaneously update if there are multiple countries that overlap adoption times.

My estimated planned time schedule will look like:

1) In a week, complete research.

2) Mid April, finish maps at different zoom levels and add base content.

3) End of April, Present to class for feedback

4) Continue adding new content until it's finished up to the end of the semester.